|
Bloom's Revised Taxonomy and the SAMR model are directly linked in that they are both strategies for promoting high level thinking in students. I feel that the simplest way to explain this link is through a real life scenario accompanied by a diagram I have made using Bubbl.us and adapted from Kathy Schrock's Guide to Everything. Consider a science experiment conducted individually by students. The aim is to explore the impact of fertiliser on plant growth rate as well as the need for large sample sizes to produce robust scientific results. With no use of ICT at all, students could manually draw a graph of their own results after writing them into their laboratory notebook. Now follow the diagram below as I improve upon this lesson step-by-step using the SAMR Model. Watch how it clearly links in to Bloom's Taxonomy. 1) SUBSTITUTION: Swap the lab notebook for an excel spreadsheet and excel graph (this will save time). Ask students to create 4 excel graphs; using 20%, 50%, 80% and 100% of their sample size. Students are memorising their observations from their own experiment, observing how their results appear at small sample sizes compared to large. Visualising results becomes more clear and efficient thanks to ICT. 2) AUGMENTATION: Have the students email their spreadsheets to me once they have completed their excel input. I can combine their data to create a class-wide dataset and present them with these results. This would illustrating the benefits of sample sizes which could not be achieved individually in the time frame. It would instigate discussions over the importance of collaboration in science endeavours. 3) MODIFICATION: Upload all individual's results to a shared file and have students import all others' results into their own spreadsheets and create the results graph individually. Students can compare their results; everyone's graphs should now be identical, so when differences occur this will enable interaction between students to determine how errors were made. This still enables a discussion of the benefits of sample size, the need for collaborative approaches to science, but introduces the idea of error at the data analysis/input phase of experiments. When collaborating in science, everyone needs to follow an identical template when recording observations to avoid future errors. 3) REDEFINITION: Provide students with access to a wiki style spreadsheet where they can add their own results to the class dataset. They will see the trend lines in graphs become more obvious and clear with each added observation. Allow them to export the final dataset, save it as a "play" version and literally play around with their results. Add in outliers, reduce sample size, whatever. They can observe how these changes to the records result in changes in the observed trends. Creating false outliers in datasets and observing their impact is a fabulous way to instigate high-order thinking in a science inquiry context: "One incorrect measurement can cause 'x' difference in my results...how could I reduce my errors when my data is collected from an entire class?". HOW I WOULD COMPARE BLOOM'S TAXONOMY and SAMR: 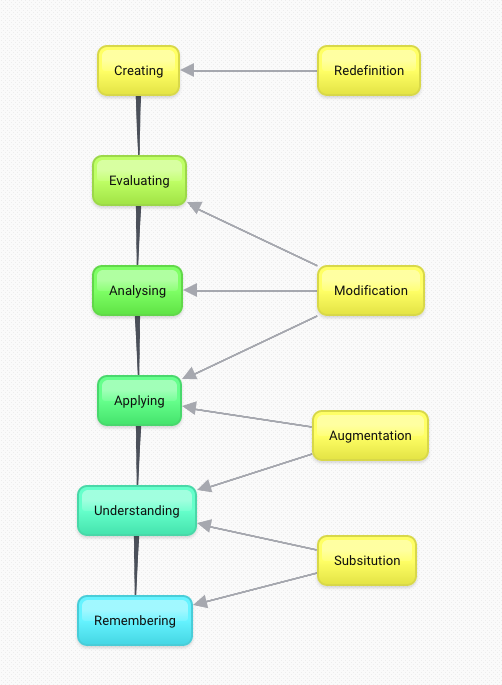 Useful References & Links
2 Comments
jo gardiner
3/19/2017 03:40:54 am
Nice work Sarah, I love the way you've used a practical application to demonstrate your understanding of this week. The tough one for me to get my head around is the redefinition phase - I'm guessing we're going to be spending most of our teaching time in augmentation/modification. 3/19/2017 07:33:21 pm
Thanks Jo. Leave a Reply. |
AuthorSarah-Louise Tapper |
Tapper Talks ICT
 RSS Feed
